


Drill Sheets >
Grades 6, 7, 8 >
Data Analysis & Probability - Drill Sheets
Data Analysis & Probability - Drill Sheets
Grades 6 to 8 - Print Book - Lesson Plan


Order #: CC3216
ISBN13: 978-1-55319-532-0
Grades: 6, 7, 8
Reading Level: 6-8
Total Page: 32
Author: Christopher Forest
Tweet
Description
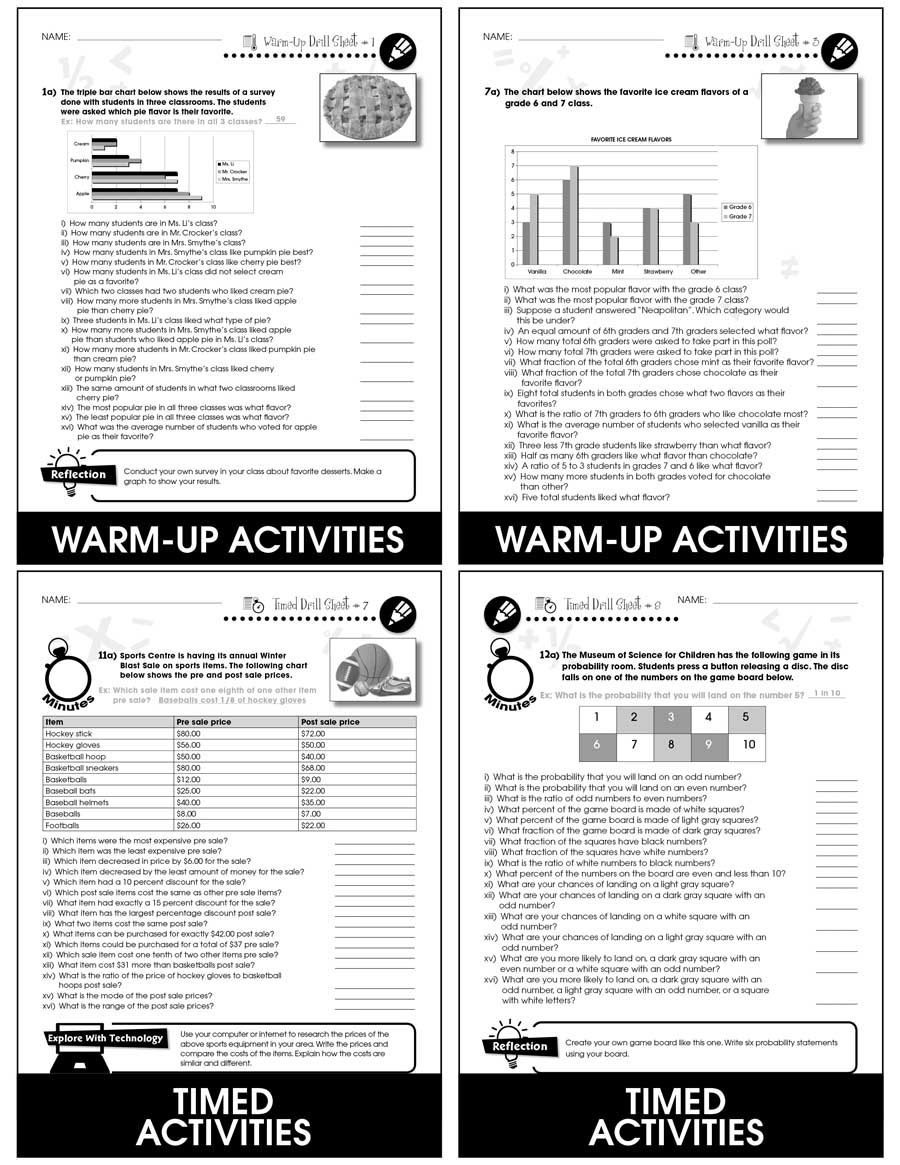
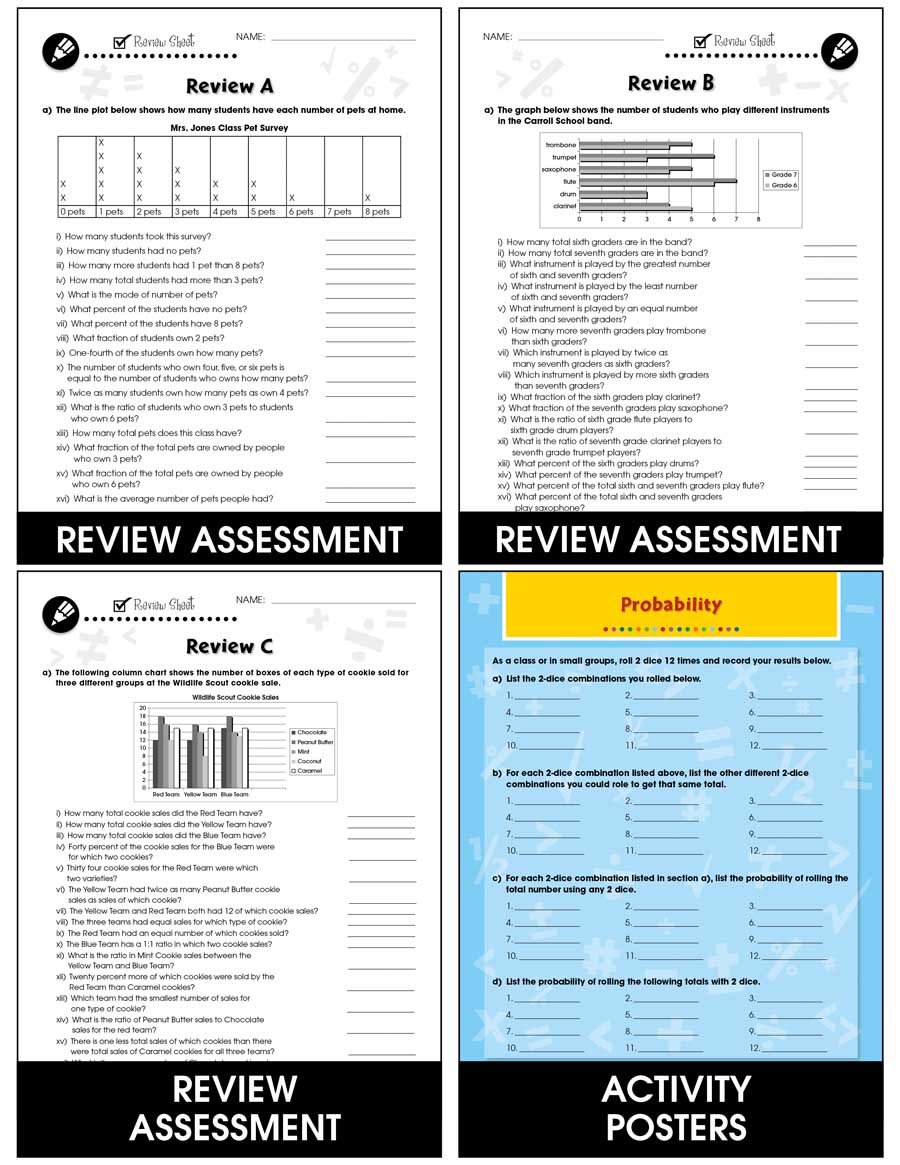
Fully comprehend data displayed in charts by converting information into percents, ratios and fractions. Our resource provides warm-up and timed drill activities to practice procedural proficiency skills. Distinguish information provided in a triple bar chart from a survey of three classrooms. Graph the results of a 5 mile (8 km) race using a graphing program. Determine the ratio of baseballs to helmets in a box. Find out what fraction of the vote someone won using a pie chart. Predict what ice cream flavor the next person you ask will like. Compare the nighttime temperatures over two days using a thermograph. Determine who won the class president election using a tally chart. The drill sheets provide a leveled approach to learning, starting with grade 6 and increasing in difficulty to grade 8. Aligned to your State Standards and meeting the concepts addressed by the NCTM standards, reproducible drill sheets, review and answer key are included.